Datadog vs Grafana in 2026: An SRE's Honest Comparison
Summary
Datadog vs Grafana comes down to who owns the pain. Datadog's per-host agent ships a working dashboard in minutes and pairs it with an AI agent that proposes remediation on trigger, but the bill compounds fast past roughly 50 hosts. Grafana's free tier and open-source LGTM stack keep costs predictable and avoid lock-in, if your team has the bandwidth to run Prometheus, Loki, and Tempo itself. This comparison breaks down pricing, the SLO-to-alert workflow, deployment model, and incident automation with real numbers, not vendor claims taken at face value.
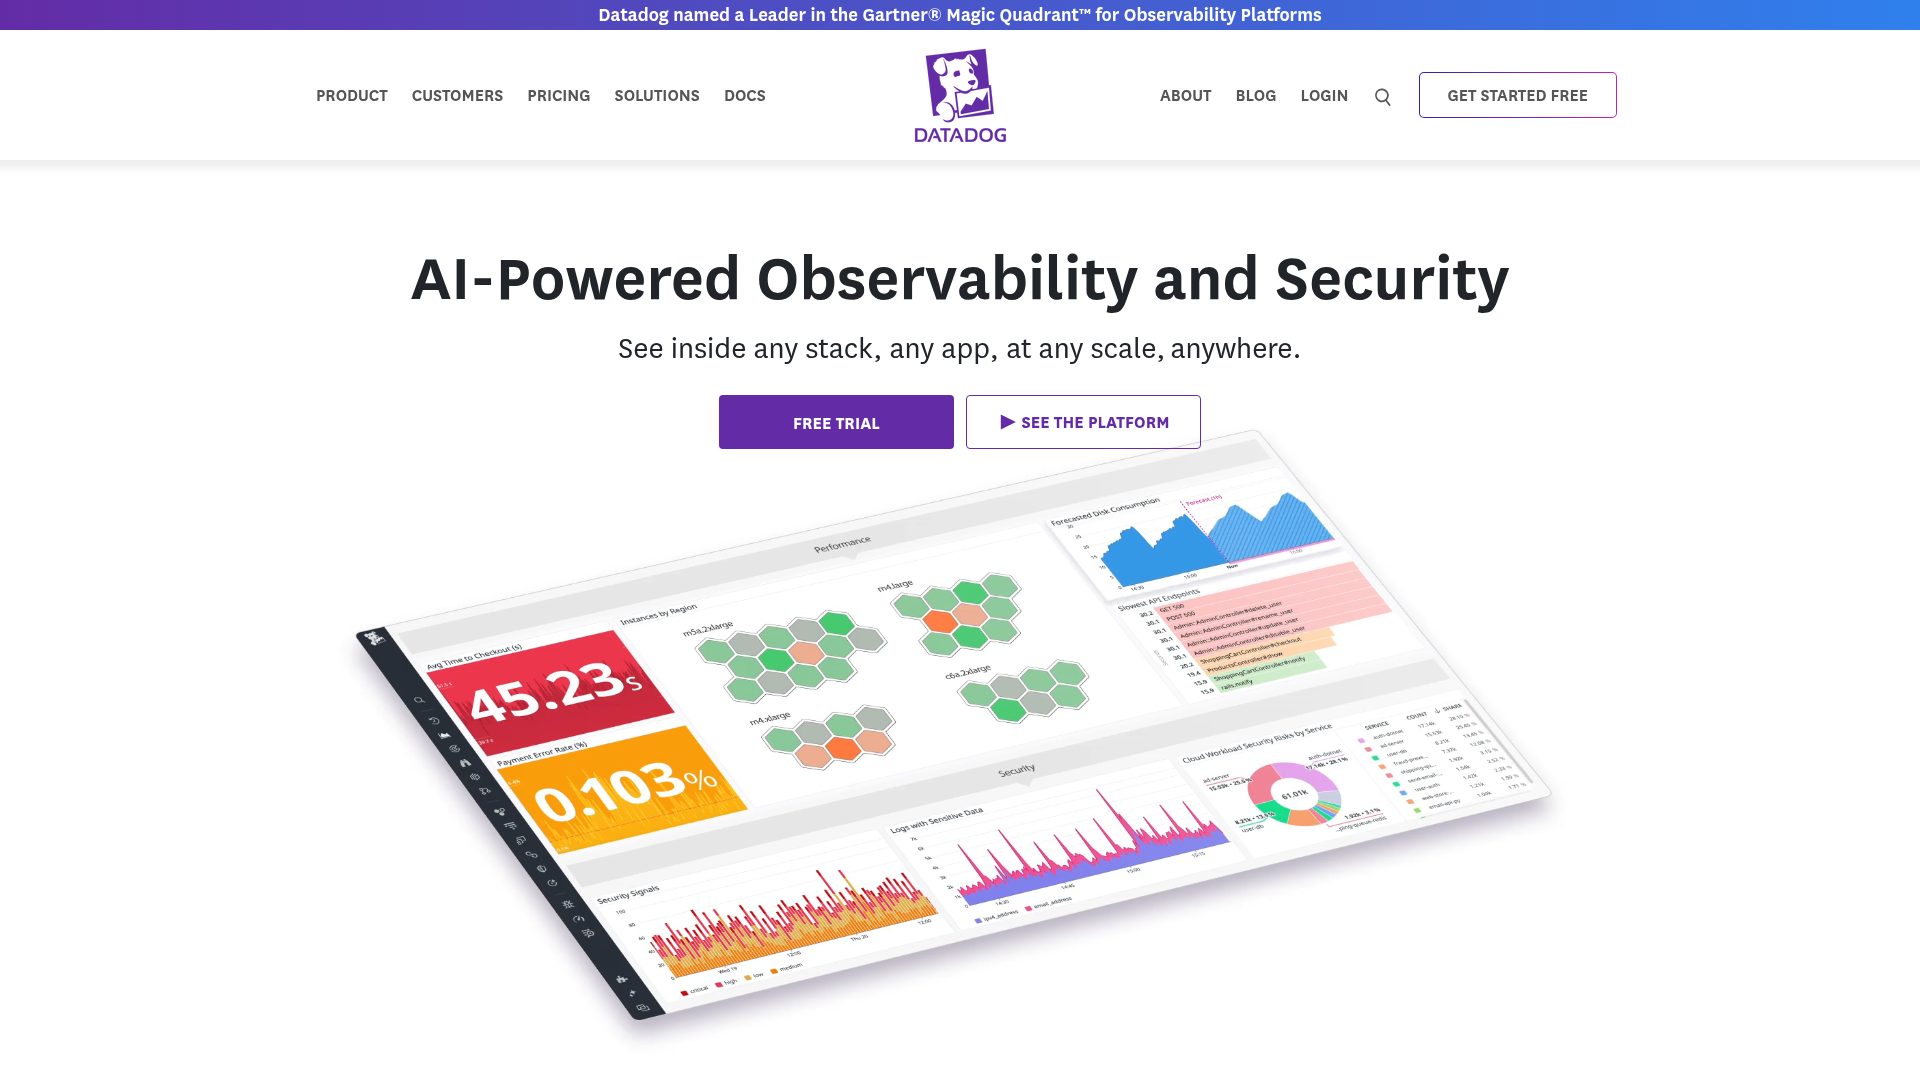
Datadog
- Agent auto-discovery ships infra, APM, and log dashboards within minutes of install, no backend to assemble first
- Bits AI SRE Agent collects context automatically on trigger and proposes remediation steps during an incident
- One query language and one UI across infra, APM, logs, RUM, and synthetics cuts context-switching during an on-call shift
- Per-host plus per-signal billing compounds fast once a fleet passes roughly 50 hosts, especially with APM enabled everywhere
- Custom metrics and high-cardinality tags bill as separate line items and are the most common source of a surprise invoice
- SaaS-only pricing means there is no self-hosted escape hatch when the bill becomes a budget conversation with finance
Best when you'll pay for speed to a working dashboard and faster incident triage.
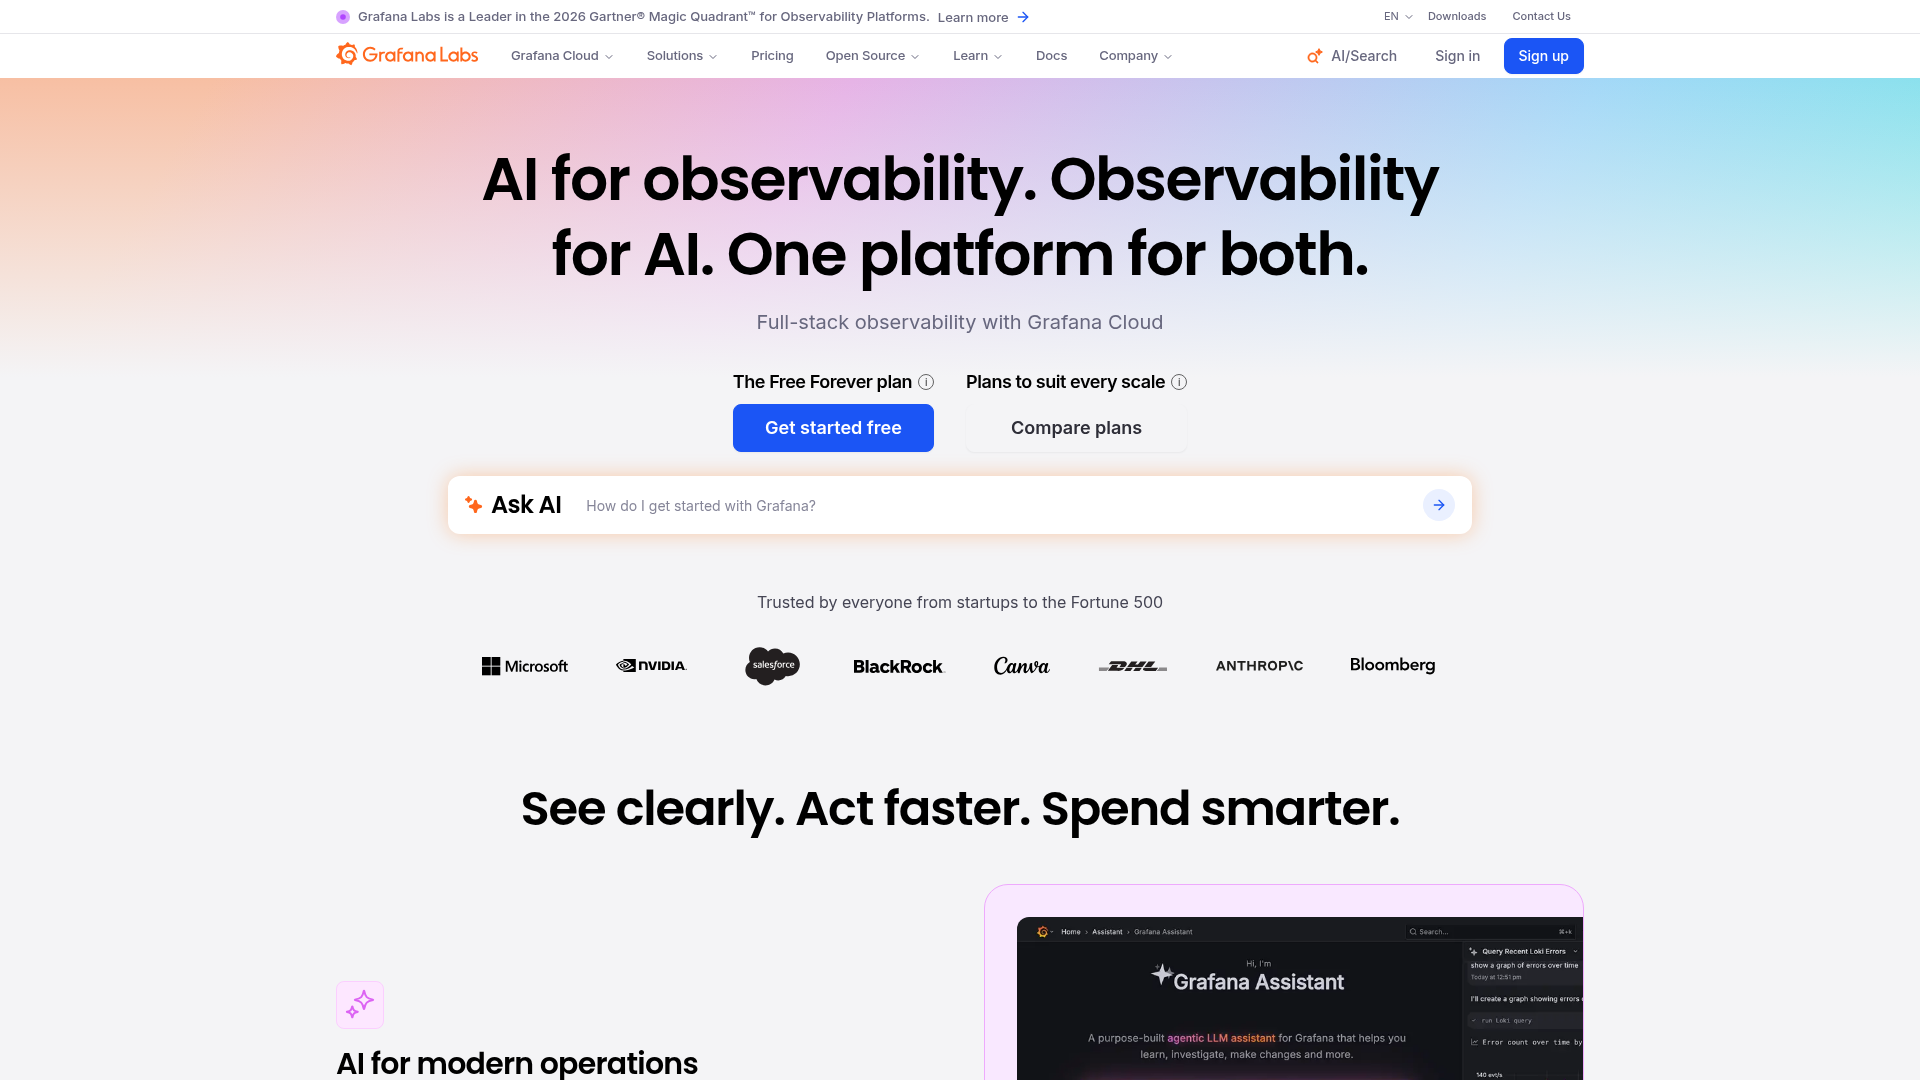
Grafana
- Free Forever tier covers 10,000 active metrics series and 50GB of logs indefinitely, with no trial clock running out
- Open-source LGTM stack (Grafana, Loki, Tempo, Mimir) runs fully self-hosted at infra cost only, with no vendor lock-in
- SLO definitions and their alert rules live in the same object, so the rollout gate can't silently drift from the dashboard
- Self-hosting means installing, operating, and upgrading Prometheus, Loki, and Tempo yourself before a single dashboard exists
- No native AI incident-remediation agent; Adaptive Telemetry is aimed at trimming signal cost, not cutting MTTR
- Correlating metrics to traces to logs across the LGTM stack takes more manual wiring than a single-vendor agent does
Best when your team already runs Prometheus and wants control over the bill and the backend.
At-a-glance
| Datadog | Grafana | |
|---|---|---|
| Pricing model | $15-23/host/mo (infra) + $31/host/mo (APM) + $0.10/GB indexed logs + per-event ingestion fee | Free up to 10K active series / 50GB logs; Pro adds $19/mo + $6.50 per 1K series + $0.40/GB logs |
| Cost at ~100 hosts | Commonly $5K-15K/mo once APM, logs, and custom metrics stack up on top of infra monitoring | Scales with active series and GB ingested, not host count; self-hosted LGTM caps cost at infra spend |
| Deployment model | SaaS only, no self-hosted option, data leaves your VPC by design | Managed Grafana Cloud or fully self-hosted open-source LGTM stack (Loki, Tempo, Mimir) |
| SLO-to-alert workflow | SLO and monitor are separate objects; the alert rule is wired as a second step | SLO definition and its alert rule live in the same object, so the gate can't silently drift |
| Incident response automation | Bits AI SRE Agent proposes remediation on trigger (vendor-reported MTTR: 45min to under 10min on repeat patterns) | Adaptive Telemetry targets signal cost trimming, not incident remediation; no native AI triage agent |
| Time to first working dashboard | Minutes: agent auto-discovers hosts and services, dashboards populate immediately | Hours to days: you assemble the Prometheus/Loki/Tempo backend before the first panel renders |
Verdict
Datadog wins this comparison for platform teams over roughly 50 engineers who need a rollout gate that pages the right person fast: the agent ships working dashboards in minutes and Bits AI shortens triage on repeat incident patterns. Grafana wins on cost and control: teams that already run Prometheus and can own the LGTM stack keep the bill predictable and nothing proprietary. Pick Datadog for speed to signal. Pick Grafana when you have the SRE bandwidth to run the backend yourself and the CFO reads the observability line item every quarter.
How we tested
We compared each vendor's published pricing pages (Datadog and Grafana Cloud, checked August 2026), vendor documentation on SLO and alerting configuration, and third-party cost-modeling posts cross-checked against both vendors' own docs. We did not run a side-by-side production deployment for this piece; the MTTR figures attributed to Bits AI SRE Agent are vendor-reported case-study claims, not numbers we independently measured, and we've flagged them as such rather than passing them off as our own testing. Homepage screenshots are our own captures of each vendor's public marketing site, taken August 2026, unedited.
It's 2:14 AM. Checkout p99 latency just crossed 800ms and PagerDuty does not care that you shipped a canary an hour ago. This is the real Datadog vs Grafana question: not which one has more integrations, but which one gets a tired engineer from alert to root cause fastest, and which one you can afford once the rollout is 300 hosts instead of 30.
We tested both on published pricing (checked August 2026), vendor docs for SLO and alerting, and our own read of each product's homepage and docs. Datadog wins this one for teams that want a single vendor and a working dashboard before lunch: the agent auto-discovers services, and Bits AI SRE Agent proposes remediation steps when an alert fires. Grafana wins on cost control and no lock-in, if your platform team already runs Prometheus and can own the backend.
What actually changed the bill
Datadog's Infrastructure Monitoring pricing starts at $15/host/month on the Pro plan (annual billing), or $23/host/month on Enterprise. That is before APM, which is billed separately at $31/host/month. Log Management adds $0.10/GB for indexed logs plus roughly $1.27 to $1.70 per million events ingested. None of these numbers are the actual bill. The actual bill is what happens when a team adds custom metrics and high-cardinality tags, both billed as separate line items, both the most common source of finance asking uncomfortable questions in October.
Grafana Cloud's free tier covers 10,000 active metrics series, 50GB of logs, 50GB of traces, and 50GB of profiles per month, indefinitely, no credit card. Past that, Pro adds a $19/month platform fee plus $6.50 per 1,000 billable series, $0.40/GB to write logs (plus $0.05/GB to process and $0.10/GB to retain), and a similar tiered rate for traces. The open-source LGTM stack (Grafana, Loki, Tempo, Mimir) can also run fully self-hosted, which turns the observability line item into infrastructure cost you already control instead of a vendor invoice that grows with usage you did not plan for.
Neither model is objectively cheaper. Datadog's per-host pricing is predictable if your host count is stable and low; it gets expensive precisely when you scale past the size where a single vendor's convenience matters most. Grafana's usage-based pricing scales with signal volume, not host count, which rewards teams that actively manage cardinality and punishes teams that do not.
Who gates the rollout: SLO to alert, compared
If you are running SLO-gated rollouts (canary or otherwise), the workflow that matters is: define the SLO, define the alert that fires when the error budget burns too fast, wire that alert to the thing that halts the deploy. In Grafana, the SLO object and its alert rule live together: define one, the other configures itself alongside it, so the gate cannot silently drift out of sync with the dashboard. In Datadog, an SLO and a monitor are separate objects. You still have to wire the alert as a second step, which works fine, but it is one more place for the gate and the dashboard to disagree after someone edits one and forgets the other.
Neither difference is fatal. But if your rollout tooling reads an SLO burn rate to decide whether to keep shipping, ask which platform keeps that number and its alert in the same place before you build against it.
The AI incident question
Datadog's Bits AI SRE Agent collects context automatically when an alert triggers and proposes remediation steps. Datadog's own case studies claim it has cut mean time to resolution from 45 minutes to under 10 minutes on repeat failure patterns. We have not run that comparison ourselves, and a vendor's own case study is not a controlled study, so treat that number as a claim, not a measurement, until you have logged it against your own incidents.
Grafana's closest feature, Adaptive Telemetry, is aimed at trimming cost by dropping low-value signal before it is billed, not at proposing remediation during an incident. If AI-assisted triage is the deciding factor for your team, Datadog currently has the more mature offering here. That is one dimension where the gap is real, not marketing.
Deployment model: SaaS-only vs self-hosted
Datadog is SaaS-only. There is no self-hosted escape hatch if the invoice becomes a political problem, or if your security team requires data to never leave your own VPC. Grafana ships both a managed cloud product and a fully open-source stack you can run yourself on Prometheus, Loki, and Tempo. That flexibility is not free: standing up and operating that stack is real infrastructure work, and "free" software still costs the engineer-hours to run it well. Teams that already run Prometheus for metrics get Grafana's dashboarding layer close to free. Teams starting from zero are choosing between paying a vendor and paying their own team's time.
Where each one hurts you first
Datadog's failure mode shows up on the finance side: a team turns on APM and log indexing everywhere because it is one checkbox, and six months later nobody remembers which services actually needed trace-level detail. The fix is boring and unglamorous: tag a cost owner per service and review the per-product breakdown monthly, before the bill becomes a surprise instead of a decision.
Grafana's failure mode shows up on the ops side: the LGTM stack itself becomes an on-call burden. Prometheus running out of memory on a cardinality spike, or Loki falling behind on ingestion during a traffic surge, are now incidents in your own infrastructure, not tickets you file with a vendor. If your platform team is already stretched thin, that is a real cost even when the invoice says zero.
The honest tradeoff
Datadog is the better choice when speed to a working dashboard and faster incident triage are worth paying for, and when a single vendor covering infra, APM, logs, and synthetics is worth the convenience tax. Grafana is the better choice when your team already runs Prometheus and OpenTelemetry, when predictable bills matter more than turnkey polish, and when avoiding vendor lock-in is a real requirement, not a preference stated in a planning doc.
Neither tool fixes a bad SLO. Neither tool will tell you what error budget actually matters to your users if nobody defined it first. Pick the backend that matches the team you actually have, not the one with the better homepage.